See the file for transformation of chart data.
Task:
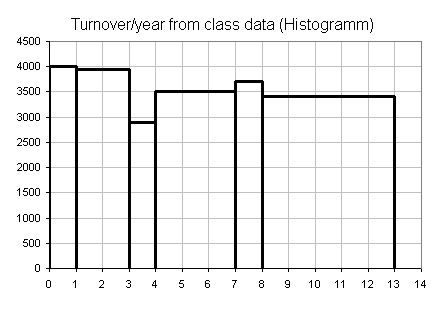
The year 1 has a turnover of 4,000; there is
another 7,900
up to end of year 3,
another 2,900
up to end of year 4,
another 10,500
up to end of year 7,
another 3,700
up to end of year 8,
further 17,000
up to end of year 13.
While it is not too difficult to find the best year, many don't know how to chart the data suitably. Extras / Analysis Functions / Histogram does not return a correct chart.
Solution:
See the file for transformation of chart data.